Re: [問題] 折線圖+長條圖呈現
想看別種繪圖嗎?
plotly: 我這不是來了嗎?
借用celestialgod的data frame作範例
library(plotly)
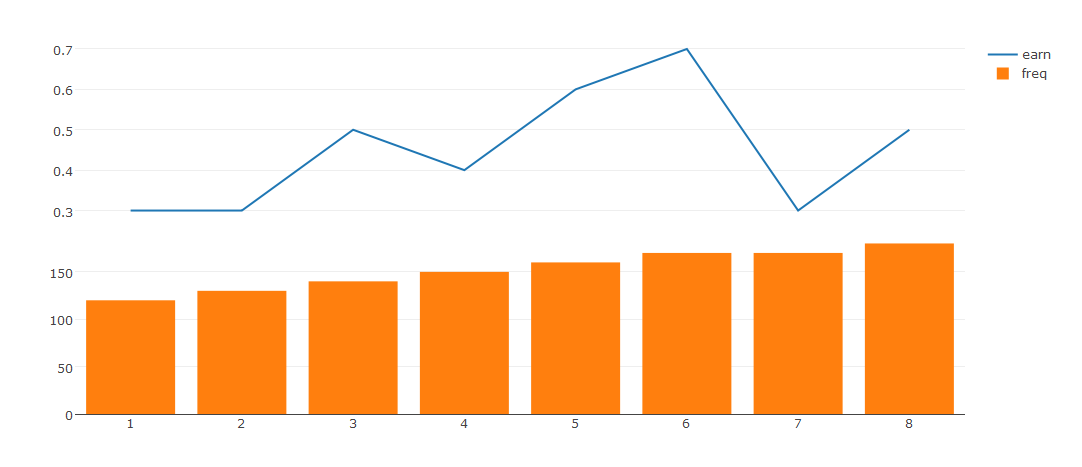
dt <- data.frame(
x = 1:8,
freq = c(120,130,140,150,160,170,170,180),
earn = c(3,3,5,4,6,7,3,5) * 0.1
)
dt_earn_plotly <- plot_ly(data = dt, x=dt$x, y=dt$earn, type = "scatter",
mode = "liners", name = "earn")
dt_freq_plotly <- plot_ly(data = dt, x=dt$x, y=dt$freq, type = "bar", name =
"freq")
dt_plotly <- subplot(dt_earn_plotly, dt_freq_plotly, nrows = 2, shareX =
TRUE)
dt_plotly
圖: http://yichunsung.github.io/plotly.png
互動介面: http://yichunsung.github.io/plotly
Code可能在Github上你會看得比較清楚:
https://github.com/yichunsung/R_Application/blob/master/plotly%20sample.R
--
※ 發信站: 批踢踢實業坊(ptt.cc), 來自: 114.34.121.188
※ 文章網址: https://www.ptt.cc/bbs/R_Language/M.1479835999.A.338.html
推
11/23 01:39, , 1F
11/23 01:39, 1F
推
11/23 01:40, , 2F
11/23 01:40, 2F
推
11/23 01:40, , 3F
11/23 01:40, 3F
推
11/23 09:54, , 4F
11/23 09:54, 4F
→
11/23 11:09, , 5F
11/23 11:09, 5F
→
11/23 11:09, , 6F
11/23 11:09, 6F
推
11/23 19:14, , 7F
11/23 19:14, 7F
推
11/23 23:02, , 8F
11/23 23:02, 8F
如果是問那個互動網頁介面的話
可以參考
https://pages.github.com
或google github pages
我就是利用plotly 做一個網頁
然後丟到自己github裡 github.io的repository裡
※ 編輯: cd12631 (114.34.121.188), 11/24/2016 00:32:47
推
11/24 00:50, , 9F
11/24 00:50, 9F
討論串 (同標題文章)
完整討論串 (本文為第 5 之 9 篇):


4
14


R_Language 近期熱門文章

PTT數位生活區 即時熱門文章